
Turf: horses, data, and predictions
A data project built around horse racing: automatic collection of upcoming meetings, predictive models, and monitoring to keep the system running day to day.
Turf brings together historical racing data and generates predictions with a confidence level. The system discovers upcoming meetings, collects the horses’ histories, and publishes its analysis on the website. I built it after I started visiting the racetrack, while I was still learning how that world worked.
My first visits to the racetrack
In early 2026, my girlfriend had bought a racehorse, and we went to the racetrack to receive it. Seeing it up close surprised me: its size, its muscles, and how gently it moved around people. Over the following weeks, we began visiting more often. I watched it train and race, and used those visits to talk with trainers and caretakers.
Some had spent decades in horse racing and could watch a horse for a few seconds before offering an opinion on its chances. Their experience included information that was difficult to find in a database. I wanted to see how close I could get to their assessments using publicly available data. That curiosity led to the project.
Collecting and maintaining the data
The information was spread across sources with different formats and levels of quality. Some could be accessed through APIs; the rest required scraping, extracting data from the pages where it was published.
Within a few hours, I had a first version collecting information. Keeping it running took more work: I needed to detect page changes, respect request limits, and keep the data consistent. A failed request could not mean repeating the entire process.
I organized collection into stages that could run and be inspected separately. That shaped the project into a data system and became a substantial part of the development work.
Automatic meeting collection
Scheduled processes check the calendar for new meetings. When they find one, they collect its races and participants, gather the horses’ histories, and retry failed requests. They then generate predictions and publish the meeting on the website. I no longer need to load each race day by hand.
After the races, another process collects available results and revisits those still pending. Those records make it possible to compare the predictions with what happened.
Monitoring the processes and the model
I needed to check that information kept arriving, even when the website seemed to be working properly. I built a dashboard showing recent process runs, upcoming tasks, and pending results. A traffic-light indicator summarizes whether anything needs attention.
The system also checks database connectivity, available disk space, and tasks that have become stuck. It can notify me through Telegram when it detects anomalies, and it has scheduled maintenance and backup routines.
I use the same dashboard to track the model’s accuracy. Its table groups races by confidence level and shows how often the first pick won and how often the winner was among the top two picks.
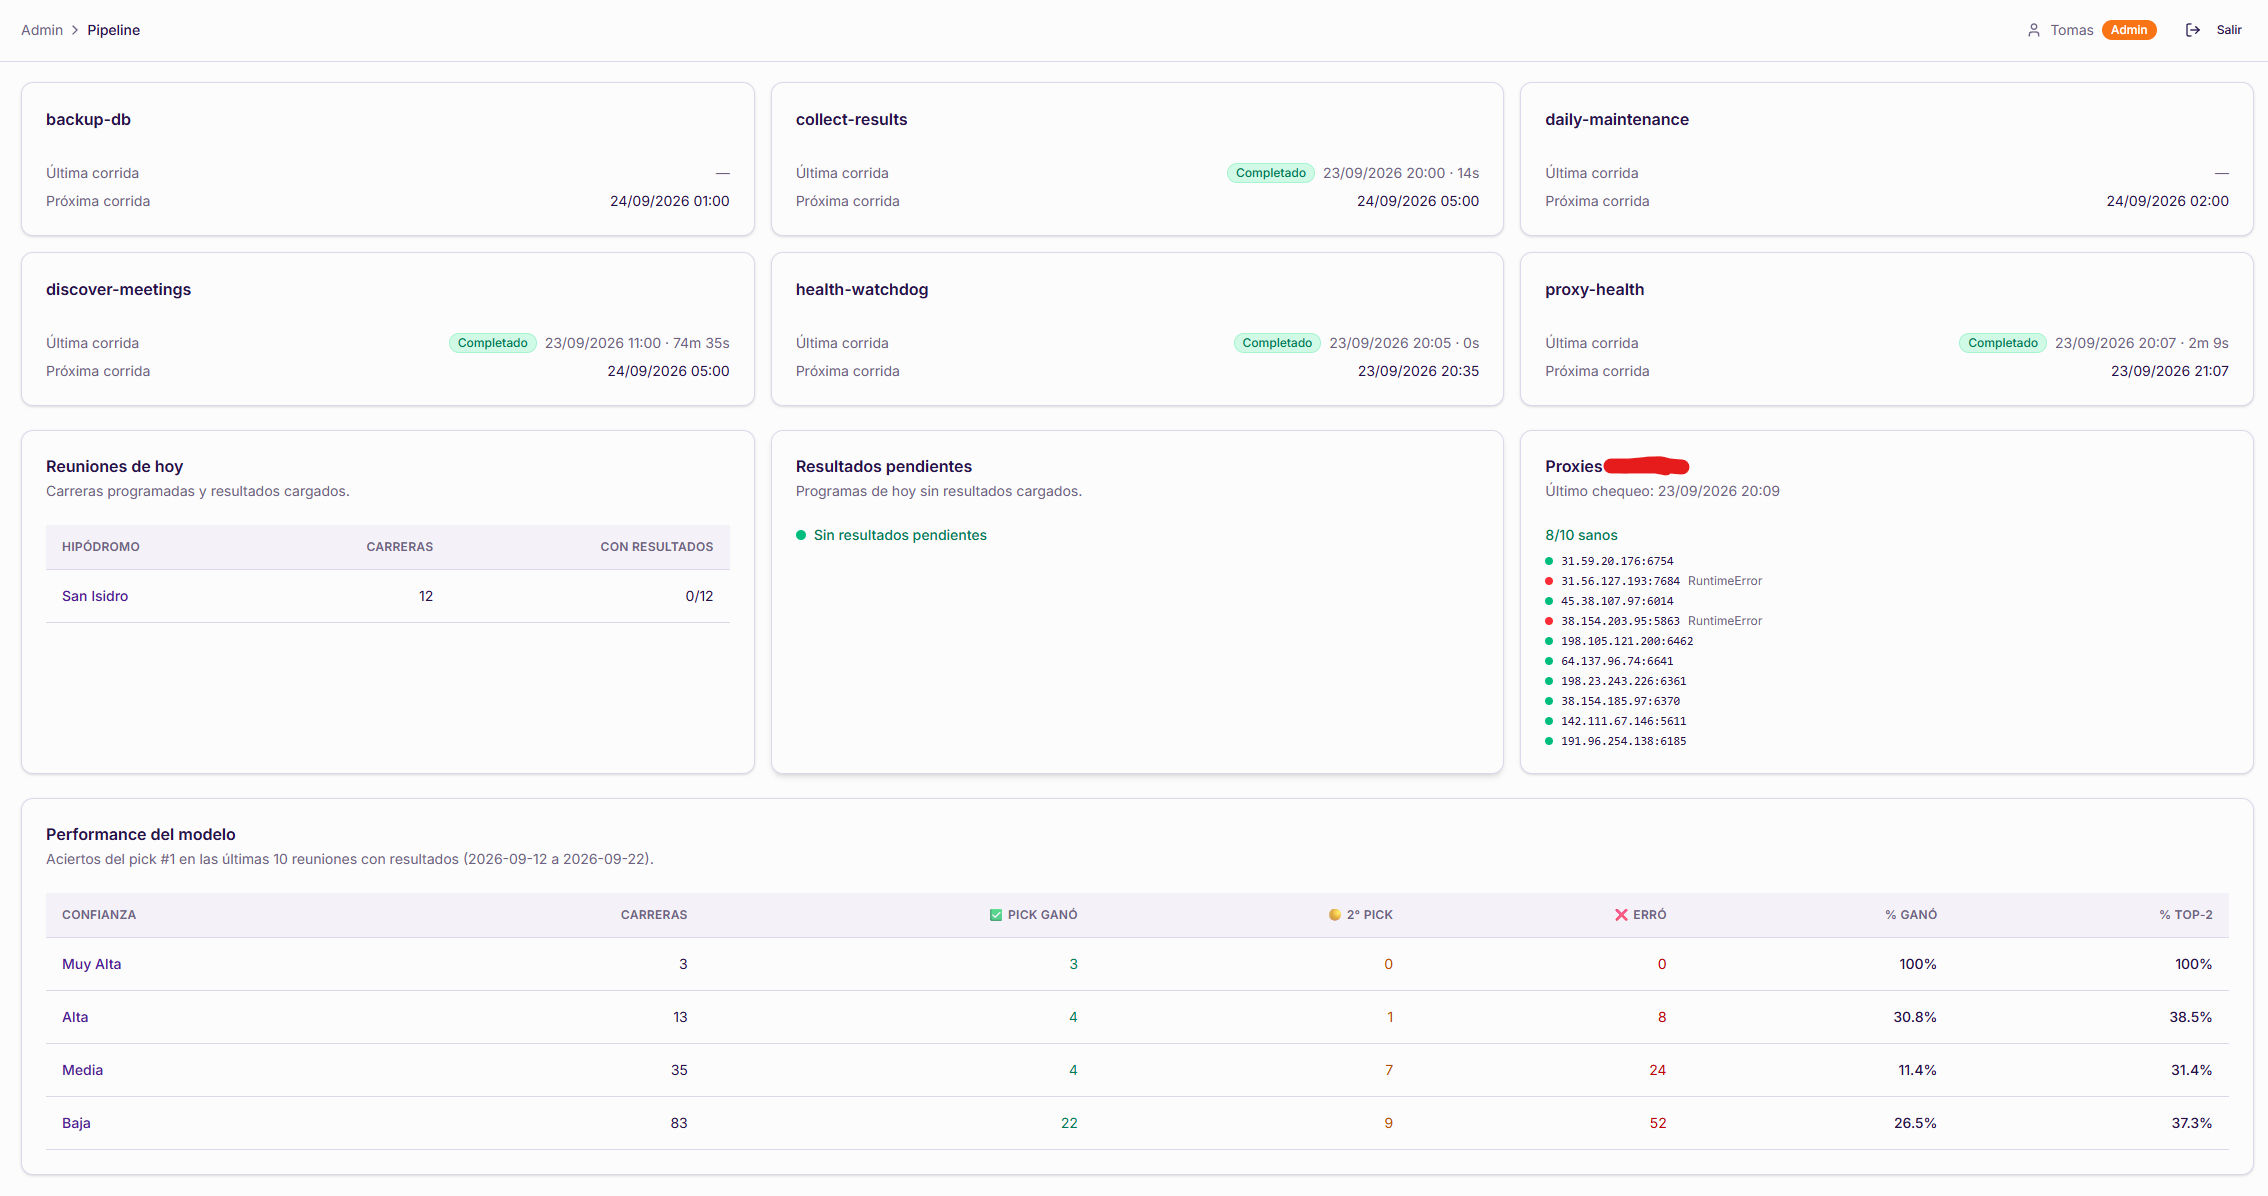
Captured on September 23, 2026. The table summarizes the last ten meetings with results: the “Very high” confidence group shows three wins from three races, a small sample within that period. Open full-size image.
Choosing the variables
I worked with more than 8,000 races in total, split between the training and test datasets. One of the biggest challenges was reducing the model’s variance as much as possible: making its behavior less dependent on the particular races used to train it and more stable when evaluating others.
At first, I added data expecting it to improve predictions. Some variables produced better results on historical races but reduced performance when the model analyzed new ones. This was overfitting: I was adjusting the model too closely to examples it already knew.
The Pareto principle helped me focus on the factors that contributed most. I reduced the number of variables and looked for more consistent behavior, even if that meant giving up some small improvements in historical tests.
Confidence in each prediction
Some information is unavailable to the model. During training, people time workouts manually, observe the horses’ physical condition, and speak with their trainers. Some of that can change the assessment of a race without ever being published in a structured form.
Alongside its choice of a possible winner, the system therefore calculates a confidence level. Races with many debutants or little history receive low confidence. When enough comparable information is available, confidence is higher. This classification lets me distinguish predictions according to the information supporting them.
The tools
I used Python and FastAPI for the backend. Celery runs background tasks, while Prefect organizes scheduled processes and records their runs. That separation lets me inspect or repeat a stage without relying on a sequence of manual steps.
I chose Next.js for the website. I am not a frontend developer, so this was one of the harder parts for me. During almost all the development, I worked with AI agents through Kimi Code, first version 2.6 and then 2.7. They helped me implement changes faster and spend more time on the algorithm and architecture decisions.
Current status
After thousands of simulations and analyzed races, I consider the model’s accuracy sufficient for this version. The home page presents evaluation metrics from races that were not used for training.
I could keep testing variables and adjusting parameters, but I chose to focus more on data quality and daily operation. This version is complete and collection is automated; I still need to investigate incidents and adapt processes when the sources change.
Conclusions
When reviewing returns, I calculated that the house keeps around 30% of the money wagered in the setup I analyzed. That margin makes a positive return difficult. Frequent correct predictions may not be enough if the chosen horses have low payouts.
Using public data, the best return I achieved in simulations was barely positive. To me, offsetting that 30% margin is a valuable result, although it does not guarantee the same outcome in future races.
Races with “Very high” confidence had a particularly high win rate in my tests. This is a very small group, and the dashboard shows that limitation alongside the percentage: the screenshot records three wins, but only three races. I want to keep observing it without treating its win rate as a measure of profitability.
Alongside the model’s results, I now have a system that loads meetings, processes histories, and collects results without my starting each step. I can inspect its runs and identify where the work stopped. That part of the project is what lets me keep it operating today.
Liked it? Follow my updates via RSS. Follow via RSS