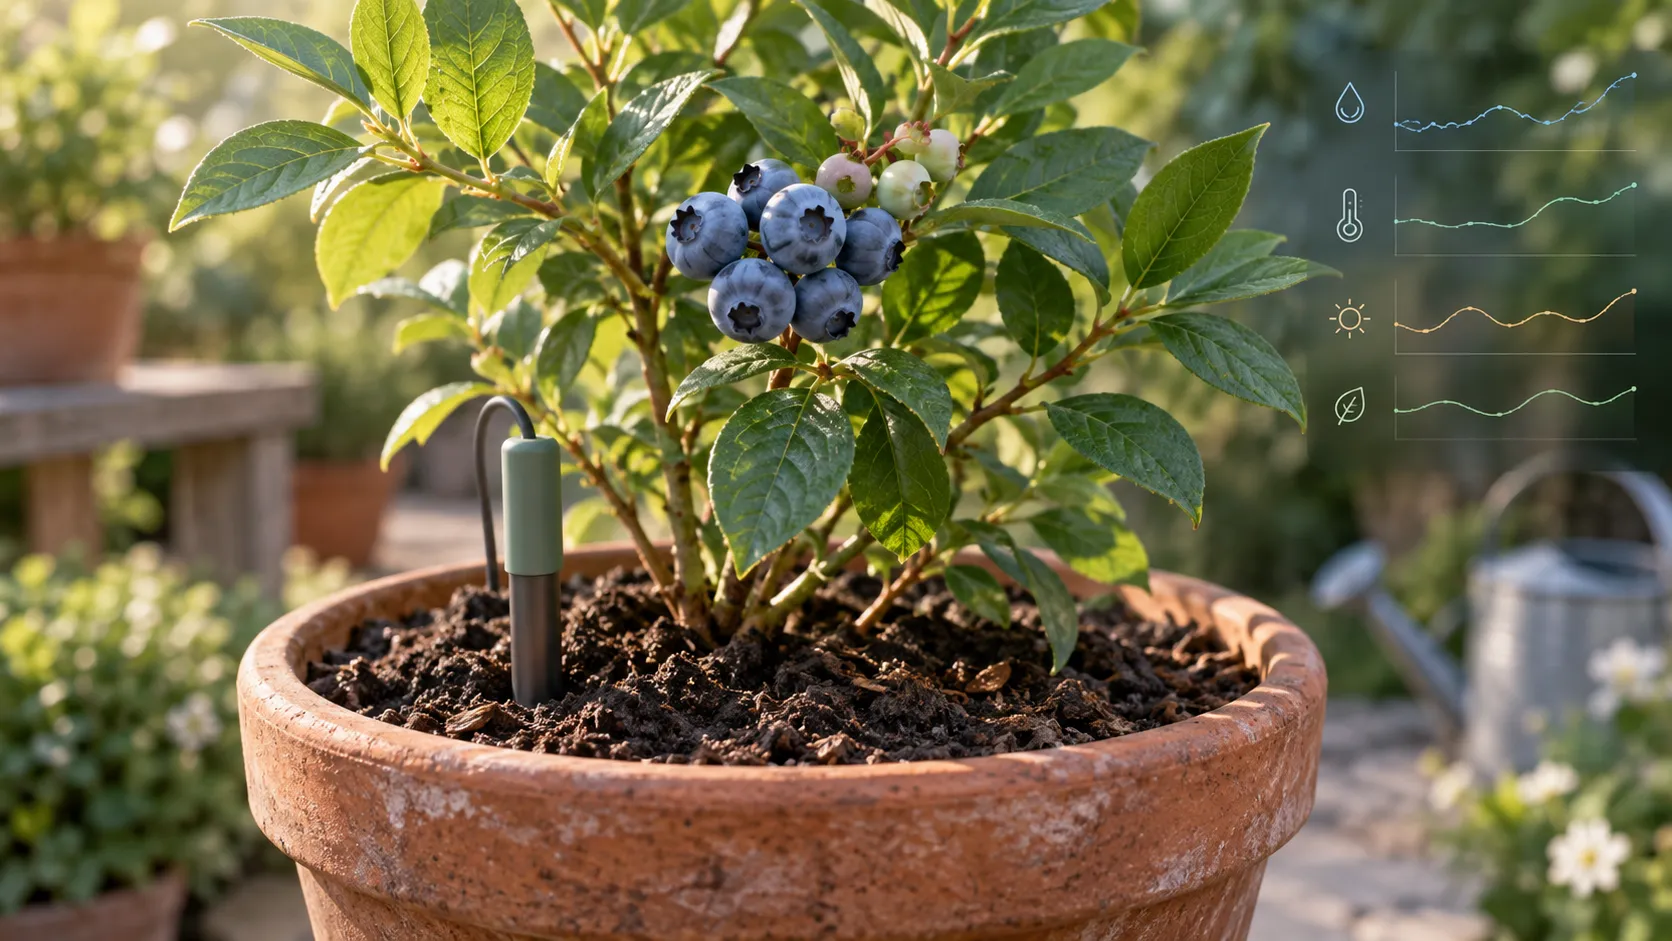
Jardín Vivo: sensors and data among the blueberries
An ESP32 station with solar power to monitor my blueberry plants: temperature, soil moisture, and historical readings that connect the garden to a website.
Jardín Vivo is a solar-powered sensor station I built to monitor my blueberry plants through a website. It records temperature, air humidity, and soil moisture, keeping the readings so I can check how they change over time.
The same dashboard shows battery level and Wi-Fi signal strength. Those readings let me check whether the device in the garden is still running and sending measurements.
From wiring to the first reading
The work started with the components and their connections. I used an ESP32, an AHT10 sensor for temperature and air humidity, and a YL-69 for soil moisture. A battery and solar panel supply the station with power.
I started by identifying the pins and assembling the circuit, then uploaded the program and checked the readings. The soil sensor needed calibration to turn its signal into a percentage with a useful reference. That value serves as a guide to the moisture the device detects.
Next came the server connection. The ESP32 sends measurements over Wi-Fi, and the website makes them accessible without walking up to the equipment or connecting it to a computer by cable.
Power consumption and solar charging
To reduce power consumption, the device stays in a low-power mode between readings, with its sensors switched off. Under normal conditions, it wakes up to capture and send data once an hour.
That frequency adapts to the battery’s charge level. When several cloudy days occur in a row, as they did in the week before I wrote this article, the solar panel supplies less energy. If the battery runs low, the system spaces out measurements and transmissions to prioritize recharging, also reducing Wi-Fi use. Once enough charge is restored, it returns to its usual hourly cycle.
The battery history lets me relate those changes in frequency to the available charge and understand why readings arrive further apart during some periods.
Following changes over time
The dashboard shows the latest available reading and charts for each variable. It supports the last day, the last week, or a custom period, with a choice of which measurements to display.
I also included a visual log ready for dated photos of the blueberry plants as they grow. The idea is to complement the numbers with what can actually be seen in the plants.
Current status
I consider it complete. The station takes measurements and sends them to the website, where I can review the garden’s history and check how much battery charge is left for the next cycles.
Liked it? Follow my updates via RSS. Follow via RSS